
本文在飞书文档完成,所以导出为md格式有一些排版问题,另附PDF文件,建议阅读PDF文件。
Safepoint bias problem
When I tried to generate flame graphs using async-profiler, the introduction of the tools caught my attention:
This project is a low overhead sampling profiler for Java that does not suffer from Safepoint bias problem. It features HotSpot-specific APIs to collect stack traces and to track memory allocations. The profiler works with OpenJDK, Oracle JDK and other Java runtimes based on the HotSpot JVM. – GitHub - async-profiler/async-profiler: Sampling CPU and HEAP profiler for Java featuring AsyncGetCa
So what is the safepoint bias problem? Maybe we need to first learn about safepoint:
A safepoint is a range of execution where the state of the executing thread is well described. Mutator threads are threads which manipulate the JVM heap (all your Java Threads are mutators. Non-Java threads may also be regarded as **mutators **when they call into JVM APIs which interact with the heap). At a safepoint the mutator thread is at a known and well defined point in it’s interaction with the heap. This means that all the references on the stack are mapped (at known locations) and the JVM can account for all of them. As long as the thread remains at a safepoint we can safely manipulate the heap + stack such that the thread’s view of the world remains consistent when it leaves the safepoint. –Safepoints: Meaning, Side Effects and Overheads
When JVM starts some events (such as GC, heap dumping), it needs to ensure all threads are in a consistent state, so JVM needs to bring threads to safepoints and pause them, then start the safepoint operation.
You can read this blog post to learn more about safepoints Safepoints: Meaning, Side Effects and Overheads
Some Java sampling execution profilers are based on the JVMTI method _JvmtiEnv::GetAllStackTraces(0, &stack_info, &thread_count) _to get stacks,which need all threads hit global safepoints. But if we only take samples at safepoints, the result may be meaningless or biased. I’d like to use a case from Why (Most) Sampling Java Profilers Are Fucking Terrible to introduce the Safepoint bias problem:
@Benchmark
@CompilerControl(CompilerControl.Mode.DONT_INLINE)
public void blameSetResultDeeper() {
  byte b = 0;
  for (int i = 0; i < size; i++) {
    b += buffer[i];
  }
  setResult4(b);
}

private void setResult4(byte b) {
  setResult3(b);
}

@CompilerControl(CompilerControl.Mode.DONT_INLINE)
private void setResult3(byte b) {
  setResult2(b);
}

private void setResult2(byte b) {
  setResult(b);
}

private void setResult(byte b) {
  setResult(b == 1);
}

@CompilerControl(CompilerControl.Mode.DONT_INLINE)
private void setResult(boolean b) {
  result = b;
}

}
We can easily determine the time is spent in the loop at blameSetResultDeeper, but if we use the profiler of JMH,we can see this result:
….[Thread state: RUNNABLE]………………………………………………………………
50.0% 50.1% java.net.SocketInputStream.socketRead0
49.5% 49.6% safepoint.profiling.SafepointCase.setResult
0.1% 0.1% org.openjdk.jmh.util.Deduplicator.dedup
0.1% 0.1% safepoint.profiling.SafepointCase.setResult4
0.1% 0.1% sun.reflect.NativeMethodAccessorImpl.invoke0
0.1% 0.1% sun.misc.Unsafe.compareAndSwapInt
We can see the profiler think the time is spent in the method setResult.This is because there is no safepoint poll in the count loop, and methods will have a safepoint at method exit. So the profiler blames the method **setResult **.The blog post Why (Most) Sampling Java Profilers Are Fucking Terrible and the paper_ Evaluating the Accuracy of Java Profilers _explain the safepoint bias problem in more detail.
Evaluating the Accuracy of Java Profilers
Mytkowicz T, Diwan A, Hauswirth M, et al. Evaluating the accuracy of Java profilers[J]. ACM Sigplan Notices, 2010, 45(6): 187-197.
1.Introduction
Performance analysts use profilers to identify hot methods.If a profile is incorrect, it may mislead the performance analysts into optimizing cold methods, thus wasting effort. This paper shows that four Java profilers (xprof,hprof,jprofile and yourkit) often produce incorrect profiles and provides a detailed analysis.
The contributions of this paper are as follows:
- Show that commonly-used profilers often disagree with each other and thus are often incorrect.
- Use causality analysis to determine whether or not a profiler is producing an actionable profile.
It is impossible to determine whether a profile is correct, because there is no “perfect” profile. Thus this paper introduce the notion of **actionable **to approximate the correctness of a profile. A profile is “actionable” if acting on the profile yields the expected outcome. For example, if a profile of an application identifies method _M _as hot, then we expect that optimizing _M _will significantly speed up the application.
- Show that commonly-used profilers often do not produce actionable profiles.
- Show that the observer effect biases the profiles. In particular, dynamic optimizations interact with a profiler’s sampling mechanism to produce profiler disagreement.
- Introduce a proof-of-concept profiler that addresses the above mentioned source of profilers bias.
2.Motivation
This paper used an example to introduce the problem:
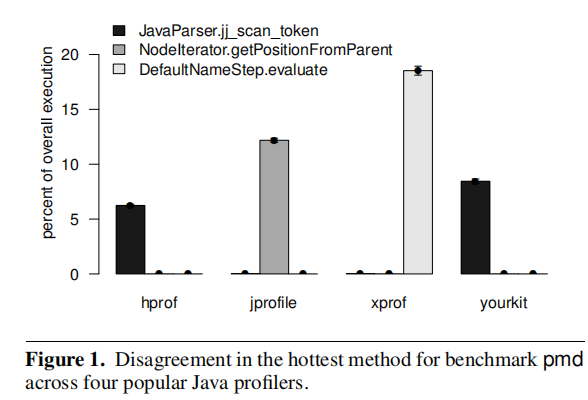
This figure illustrates the amount of time that four profilers(xprof,hprof,jprofile and yourkit) attribute to three methods from the pmd DaCapo benchmark.We can see that the four profilers disagree dramatically about which method is the hottest method.Clearly, when two profilers disagree, they cannot both be correct.
3.Experimental methodology
This paper used the single-threaded DaCapo to evaluate four profilers.In Section 1,we introduce this paper use the notion of _actionable _to approximate the correctness of a profile. But even if we know which methods are hot, we may not be able to optimize them.So this paper chose to slow down hot methods. If a method is hot, then slowing it down further should only make it hotter in the profile. If it does not, then the profile (before or after slowing it down) was not actionable. Other details such as overhead, platform and experimental settings can be seen in the paper.
4.Extent of the problem
Section 2 demonstrated that at least for one program, four profilers identify three different “hottest” methods. Based on this problem, this paper explores four questions.
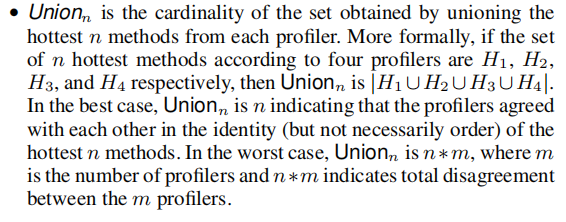
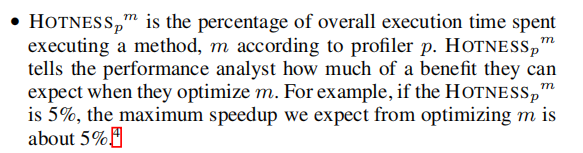
4.1 Metrics for quantifying profilers agreement
This paper use two metrics to quantify profiler agreement:
4.2 How frequently do profilers disagree?
Figure 2 shows $Union_1$ metric for four profilers($Union_1$ will be 1 if all profilers agree on the hottest method and 4 if the four profilers totally disagree on the hottest method).We can see that if we use a profiler to pick the hottest method we may end up with a method that is not really the hottest.
Figure 3 presents $Union_n$ for n ranging from 1 to 10 (The line $y = 1 * n$gives the best possible scenario for profilers agreement and the line $y = 4 * n$gives the worst case scenario).We can see that even if we look beyond the hottest method and disregard the ordering between the hottest few methods, we still get profiler disagreement.
4.3 By how much do profilers disagree?
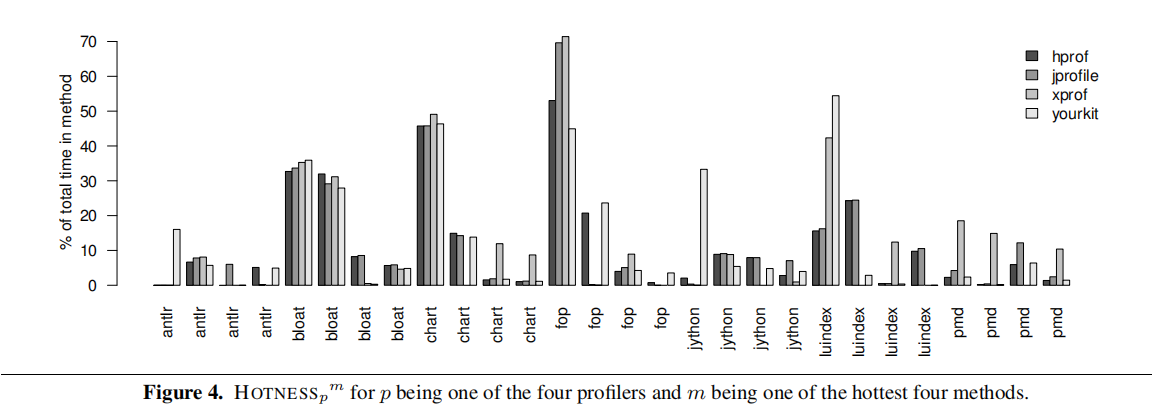
Figure 4 presents the percentage of overall execution time for four hot methods in each benchmark. We can see that profilers disagree and attribute different amounts of time to the same method.
4.4 Is profilers disagreement innocuous?
If two profilers identify different methods as the “hottest” but the two methods are in a caller-callee relationship then the disagreement may be innocuous, because when tuning we usually check the caller and the callee of the hot methods.
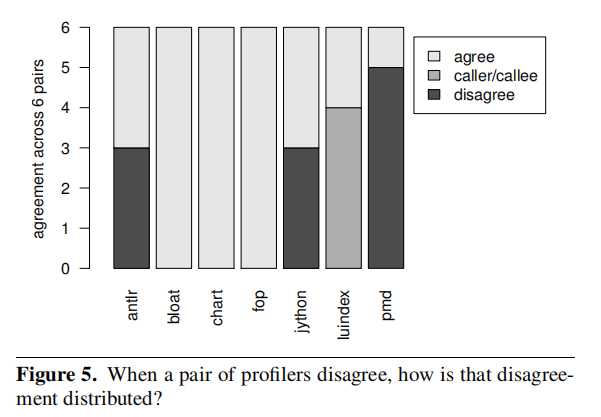
Therefore, Figure 5 categorizes profiler disagreement to determine if the caller-callee relationship accounts for most of the disagreement between profilers.Three out of the four times when a pair of profilers disagree their hottest methods are not in a caller/callee relationship. In other words, profiler disagreement is not innocuous.
4.5 Is the JVM the cause of profiler disagreement?
This paper found the same kinds of profiler disagreement in Hotspot and J9. Thus, profiler disagreement is not an artifact of a particular JVM.
5. Causality analysis
This paper use a Java agent that uses **BCEL **(a bytecode re-writing library) to inject a while loop to compute the sum of the first $f$ Fibonacci numbers into the program, where $f$ is a parameters specified in the configuration file. In this way slow down the hot methods.
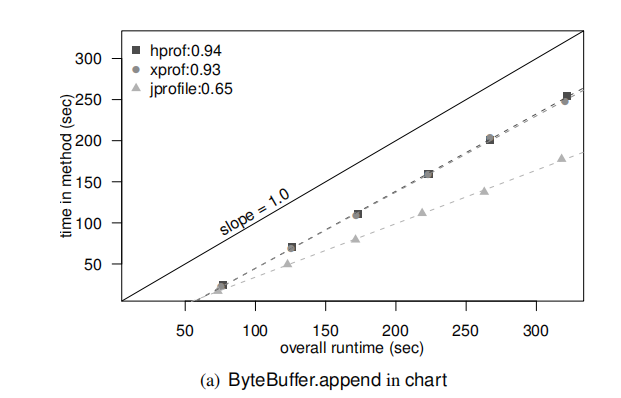
In this figure, the leftmost point is for$f$ = 100; each subsequent point adds 200 to $f$. A point (x, y) on a line for profiler, $P$, says that when the overall execution time of the program is x seconds, $P$ attributed y seconds of execution time to the method. In the perfect case, we expect each profiler’s line to be a straight line with a slope of 1.0.
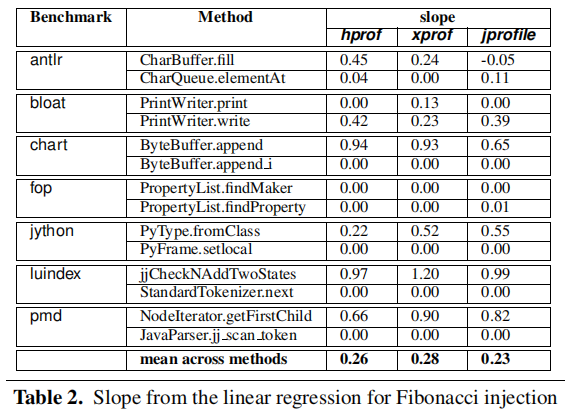
Table 2 gives the slopes for all benchmarks and profiler pairs. From this table, we can see that the slopes are rarely 1.0. In other words, except for very few cases, these three profilers do not produce actionable profiles.
6. Understanding the cause of profiler disagreement
6.1 The assumption behind sampling
The four profilers explored in this paper all use sampling to collect profiles. However, for sampling to produce results that are comparable to a full profile, the following two conditions must hold:
- We must have a large number of samples to get statistically significant results.
- The profiler should sample _all _points in a program run with _equal _probability.
We can guarantee the first condition by running a profiler for a long time. Therefore,it is likely that profilers are generating non-actionable profiles because they do not meet the second condition.
6.2 Do our profilers pick samples randomly?
A method for collecting random samples is to collect a sample at every $t+r$ milliseconds, where $t$ is the desired sampling interval and $r$ is a random number between $−t$ and $t$.
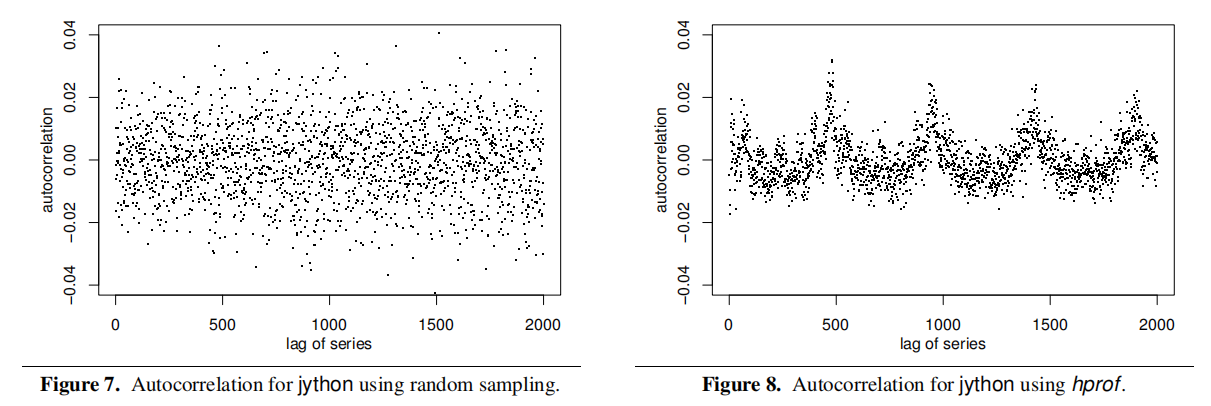
Figure 7 gives the autocorrelation graph for when we take samples with a random component $r$. As expected, it looks random. In contrast,Figure 8 shows that the samples are not randomly picked when using hprof. Thus, profilers are not using random samples and violating the second condition.
6.3 What makes the samples not random?
All four profilers only sample at safepoints (referred to as yield points in this paper).JIT compilers aggressively optimize the placement of safepoints and unrelated optimizations (e.g., inlining) may also affect the placement of safepoints.Consequently, a profiler may attribute a method’s samples to another seemingly unrelated method.
6.4 But why do profilers disagree?
While the above discussion explains why our profilers produce non-actionable profiles, it does not explain why they disagree with each other.
Any profiler, by its mere presence (e.g. due to its effect on memory layout, or because it launches some background threads), changes the behavior of the program (observer effect). Because different profilers have different memory requirements and may perform different background activities, the effect on program behavior differs between profilers. Because program behavior affects the virtual machine’s dynamic optimization decisions, using a different profiler can lead to differences in the compiled code.
These differences relate to profilerdisagreement in two ways:
- Directly, because the presence of different profilers causes differently optimized code
- Indirectly, because the presence of different profilers causes differently placed safepoints.
Figure 9 illustrates how turning on different profilers changes xprof’s profile of a program.The height of the bar quantities the profiler’s effect on xprof’s profile for the hottest method,$M$. If xprof attributes x% of execution time to$M$when no other profilers running and y% of execution time to$M$when a profiler,$P$, is also running, then$P$’s bar will have height abs(x − y).
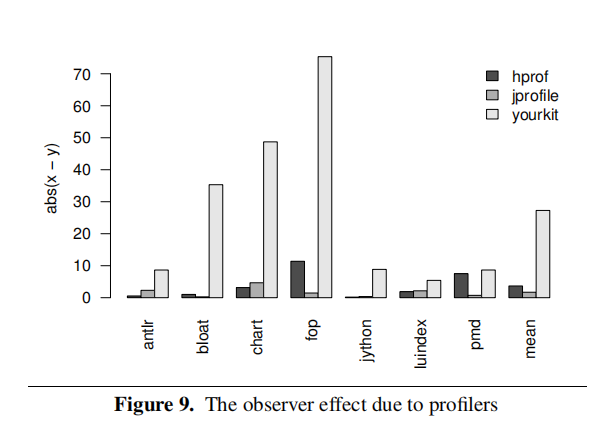
Meanwhile,this paper mention that when they profile with xprof , the JIT placed 9 safepoints per method for the hottest 10 methods of antlr. When they used hprof , the JIT placed 7 safepoints per method.
In summary, the observer effect due to profilers affects optimization decisions, which affects the placement of safepoints, which in turn results in different biases for different profilers.
7.Testing our hypotheses
The previous sections hypothesized that profilers produce non-actionable profiles because
- They sample at safepoints which biases their profiles
- They interact with compiler optimizations which affects both program performance and the placement of safepoints.
To test these hypotheses, this section presents results from a proof-of-concept profiler that does not use safepoints. The proof-of-concept profiler, tprof, has two components: a sampling thread that sleeps for the sampling interval and then uses standard UNIX signals to pause the Java application thread and take a sample of the current executing method; and a JVMTI agent that builds a map of an x86 code address to Java methods.
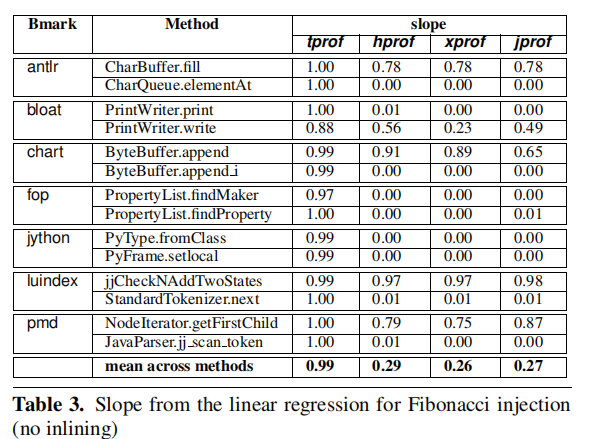
Table 3 is similar to Table 2 except that they disabled inlining in the JVM because tprof does not accurately report method locations when inlining is turned on(tprof is not a production profiler, its purpose is to support and validate the claim that a Java profiler can produce actionable profiles by ensuring its samples are taken randomly).
From Table 3, we can conclude that:
- Turning off inline improves the performance of the four profilers(as discussed in Section 6.3)
- From the tprof column we see that tprof performs nearly perfectly
Previously, this paper presented three hypotheses to explain non-actionable data from the profilers:
- reliance on safepoints which led to bias(Section 6.3)
- interactions with optimizations which directly affected profiles(Section 6.4)
- interactions with optimizations which affected the placement of safepoints and thus bias (Section 6.4)
The results show that tprof, which addresses 1 and 3(but not 2), performs almost perfectly.
Conclusion
This paper shows that four Java profilers (xprof, hprof, jprofile, and yourkit) often generate incorrect profiles,and uses causality analysis to determine two reasons why profilers generate incorrect profiles:
- The profilers only sample at safepoints
- The profilers perturb the program being optimized (i.e. observer effect) and thus change how the dynamic compiler optimizes the program and places safepoints in the optimized code.
Finally, this paper shows that a proof-of-concept profilerthat does not use safepoints for sampling does not suffer from the above problems.
Summary
- The logic of this paper’s analysis is worth learning:
Present a motivating example(Section 2) ->Intorduce the experimental methodology(Section 3) -> Illustrate the problem is important and universal(Section 4) -> Use causality analysis to determine profiler often produce non-actionable data(Section 5) -> Explore why profilers often produce non-actionable data(Section 6) ->Test the proposed hypotheses(Section 7)- For sampling to produce results that are comparable to a full profile, the following two conditions must hold:
- We must have a large number of samples to get statistically significant results.
- The profiler should sample all points in a program run with equal probability.*
- Two reasons why profilers generate incorrect profiles:
- The profilers only sample at safepoints.
- The profilers perturb the program being optimized (i.e. observer effect) and thus change how the dynamic compiler optimizes the program and places safepoints in the optimized code.
- Be skeptical of any performance observability tools we use.
Resources
Nitsan Wakart, Safepoints: Meaning, Side Effects and Overheads:http://psy-lob-saw.blogspot.com/2015/12/safepoints.html
Nitsan Wakart,Why (Most) Sampling Java Profilers Are Fucking Terrible:http://psy-lob-saw.blogspot.com/2016/02/why-most-sampling-java-profilers-are.html
Mytkowicz T, Diwan A, Hauswirth M, et al. Evaluating the accuracy of Java profilers[J]. ACM Sigplan Notices, 2010, 45(6): 187-197.